
The current COVID-19 pandemic situation exposed the limitations of Local SCADA systems deployed at plant locations and the importance of monitoring plants from “Anywhere and Anytime”.
The next generation IIOT SCADA ETi-SOL 5.0 released in June 2020 by EnerMAN Technologies goes beyond just monitoring of Solar PV plants. The ETi-SOL 5.0 platform is purpose-built to do “Not only Monitoring (NoMon)” but also transforming PV plant data into Knowledge so that all the stakeholders of PV plant (plant owner, O&M Manager, technician) benefit from it.
Here are some of the salient features of ETi-SOL 5.0 SCADA:
The Portfolio Page
This is the dashboard that can provide plant and portfolio level KPIs like Generation, PR, Plant Status, etc. This data is very useful for the plant owner as well as O&M Manager to know how their plants are performing on a day. The SCADA transforms generation data into carbon footprint knowledge that the owner can take pride in how he is contributing to a healthier planet.
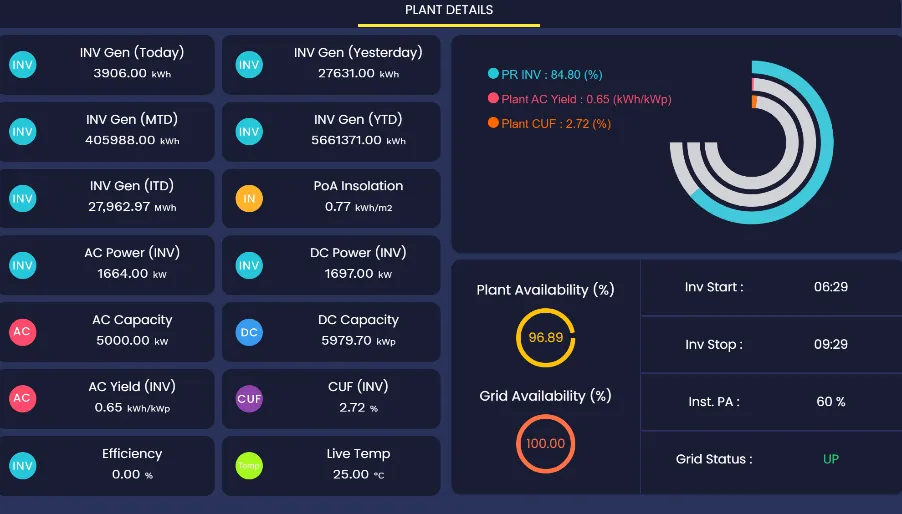
The Plant Overview Page
This dashboard is designed after taking inputs from many customers with a combined portfolio of 900+ MW. The technician can get complete knowledge about how his plant is operating. Some of the performance metrics are generation, insolation, peak power, total power, PR, CUF, yield etc. Many of the components on this page are customizable to the specific needs of a customer. If a key performance indicator is outside the expected range, there is a provision for the technician to share the incident knowledge to the managers at HQ by adding Bulletin messages.
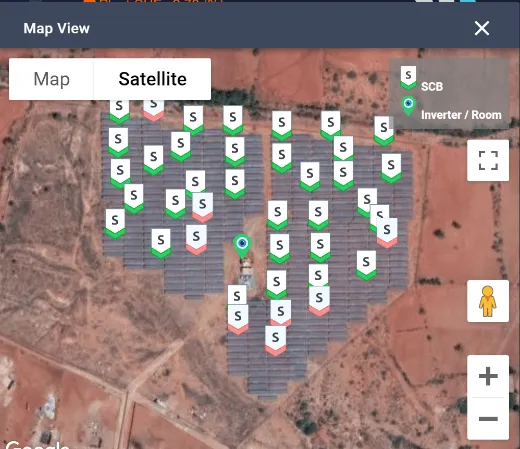
The Mapview page displays all Inverters and SCBs on a Google Map with exact geo-coordinates of the plant and the color of Inverters and SCBs become red if there is a device fault.
SLD diagrams
The SLD diagrams are very important for an electrical engineer or technician to do live monitoring and take quick action if a device turns red due to a fault. This page is custom-built for each plant based on how the plant is designed by referring to its schematic diagrams.
The Device Dashboards
All major devices like Inverter, SCB, Weather Station of a plant have their own dashboards and can be accessed from this page.
The Inverter dashboard displays hourly, daily, and monthly generation and insolation in a Graph.
The users of SCADA can drill down from Plant->Block->InverterRoom->Inverter level to get the generation information.
As part of EnerMAN Technologies’ efforts to deliver Knowledge, not just data, the Inverter dashboard has a unique feature called “Dip Reason”. The Dip Reason window automatically displays if there is a dip in energy generation due to Grid Outage and/or Inverter faults. There is also a provision for a technician to manually enter any other reason which is not automatically inferred by the SCADA system.
The SCB dashboard displays any underperforming strings so that the technician can take action just by looking at color-coded information.
The Weather Station dashboard displays all the weather-related data of the plant in both graph and table view.
The Analytics Page
The user can download pre-defined daily, monthly, and yearly reports by a click of a button.
The user can pick and choose primary parameters across different devices and analyze trends and performances in a graph or table view.
In addition to primary data, the user can also analyze and download computed KPIs like PR, Yield, Insolation, and DGR (Daily Generation Reports).
The Alarm Page
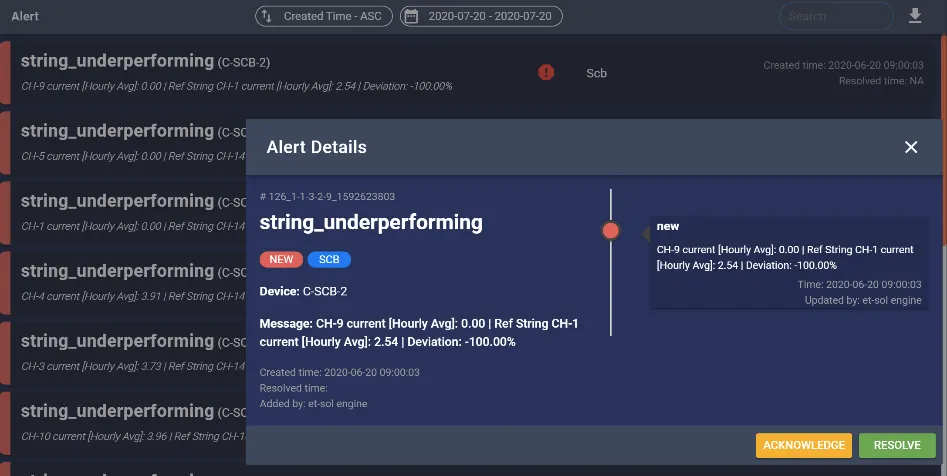
No SCADA is complete without an Alert module. The ETi-SOL 5.0 works closely with datalogger ETi-LOG to provide real-time, robust, and accurate alarms and events. It has two levels of Alarm detection logics, the primary logic deployed in the edge device (ETi-LOG) and the secondary logic deployed in the SCADA (ETi-SOL 5.0). This extra layer of alert logic ensures that the user will not miss an Alarm.
The alert module sends in-app notifications to users and has an inbuilt escalation matrix. The O&M manager and the plant owner are notified in the app if an alert stays unresolved.
The ETi-SOL 5.0 is an end-to-end solution completely in-house developed to deliver accurate and real-time operational analytics of PV plants to the O&M team and plant owners at an exceptionally attractive price. EnerMAN Technologies takes pride in “Vocal” about “Local” transformation currently happening across India.
ETi-SOL IIOT SCADA: The New Age Of Predictive Maintenance
Setting up a solar power plant is not an easy task. But a more persisting and resource-consuming activity to keep the plant going is Operation and Maintenance (O&M). On a Solar photovoltaic power plant, stakes are high for operation and Maintenance.
The fruits of commissioning and plant set up continue to bear the same amount of performance, only if there is a continual operation and maintenance activity. Although the traditional practice involves preventive maintenance activity done on a periodic basis, it is now time to make smart choices and decisions. Predictive maintenance is the key.
Predictive maintenance is a proactive maintenance strategy, that predicts the possible failure or low performance of an equipment in the future, backed by the data collected from the same equipments. This strategy not only reduces the downtime of equipment but also maximizes up-time and increases the reliability, making the equipment an enhanced revenue asset.
EnerMAN’s ETi-SOL is your smart assistant for predictive maintenance. EnerMAN’s product collects the data from various sensors and devices, analyzes the data and gives out reports and alerts, from which the operation and maintenance personnel can perform predictive maintenance, even before the device might need a corrective maintenance, thereby reducing the down-time and cutting extra costs.
This remote monitoring solution not only monitors the plant data but also analyzes the captured data to provide alerts on the health of the PV plant asset. It generates daily generation reports and gives out performance rates for each equipment on the horizon.
This is how ETi-SOL leverages your predictive maintenance activities:
Comprehensive daily generation reports
ETi-SOL monitors the health of PV plant assets and gives out daily generation reports. This includes device details, daily generation details, performance rates and import to export details. This paints a picture to the O&M personnel at the end of each day. Gone are the days, where each O&M personnel was required to spend few hours a day, noting down all the values and checking the health status of all equipments. All this data analytics is just a click away!
Capacity Utilization Factor (CUF) rates
ETi-SOL reports page gives out a Capacity Utilization Factor (CUF) in percentage. This is a very critical and important insight to O&M personnel. If the rates are low, it means that it is time for a routine check. Based on the same, there are secondary alerts created for further activities.
Performance ratio (PR) and instant grid availability
Simply login and check the performance ratio of each block, device, or room. Higher rates above average indicates that all is well. Lower rate raises an alarm for maintenance activities. Another important feature is the grid availability. No need to go all the way in the field to check the grid status. It is displayed on the dashboard. If the grid is down, there are high alerts and red alerts generated to get you in notice. The in-app notification reaches you even in the field. This reduces the downtime of the grid, so that you can get to work on the go.
Insolation/reference yield & Geo-tagging
We take a quick raincheck for you and send out alerts. Rainy, summer, or winter we give your kWh/m² reading and let you know if the ratings are as expected for your area. The same will be reflected in the performance ratio and daily generation reports.
Got a huge power plant and new O&M personnel? Geotagging helps you define the exact position of your equipment and guides the personnel to attend to the problem faster.
Customizable templates
We listen to you. Render your needs. Get your dashboard the way you want it. Yes, we also take in customized alerts and reports. We represent the data the way you are used to see it. All we need is a template of yours and we are good to go.
Authors: Ravisha D N, Sr. VP – Solar Analytics, and Megha V Gopal, EnerMAN Technologies.
Products in this article
Related reading
PM-KUSUM Yojana: Benefits for Farmers and How EnerMAN Technologies Supports with IoT SCADA Solutions
What PM-KUSUM Yojana offers farmers, EPC contractors and IPPs, and how EnerMAN’s IoT SCADA panels support PM-KUSUM solar projects.
Why solar operators move to IoT SCADA: remote visibility, predictive maintenance, lower deployment cost, scalability, and PR and CUF reporting.
Bring your solar plants to one screen.
For IPPs, EPCs, utilities, rooftop owners, agri-solar and O&M providers.